Information Design: Malaysia's Road Accident Infographics
Our group are doing about Malaysia's Road Accident.
We couldn't get accurate and full set data from internet.
So Nigel called to MIROS and manage to book a time for us to visit.
3rd June 2013[Monday] me, YeeLin, Kak, Nigel and YeeLin went to MIROS which is located at Kajang.
At last we are decided to focus on "Statistical Report Road Accident 2011"
We analyse the data that we need.
 |
General statistics -Malaysia
Vehicles registered
2002 : 12,068,144
2011 : 21,311,630
Vehicles involved in Road Accident
2002 : 507,885
2011 : 817,151
Total number of Road Accidents
2002 : 279,711
2011 : 449,040
Casualties - Fatal/Deaths
2002 : 5,891
2011 : 6,877 |
 |
Road accidents by State
We are focusing on Selangor.
2002 : 73,604
2011 : 128,876 |
 |
Registered Vehicles by Registration Area in 2011 - focusing on Selangor
Motorcycles : 1,088,000
Cars : 1,019,000
Buses : 7,500
Taxis : 11,000
Lorries (kenderaan barang) : 155,500
*surprisingly more motorcycles were registered than cars. difference by around 70,000* |
 |
Road Accidents by DIstrict- focusing on Subang Jaya
Number of Road Accidents : 26,650
Deaths : 129
Serious Injuries : 42
Minor Injuries : 15 |
 |
Road Accident by Locality-focus on the number of deaths only. we don't want to have overload information.
City : 466
Urban : 867
Built- up - area : 982
Rural : 4,034 |
 |
Road Accident by Road Category-focus on deaths
Expressway : 724
Federal : 2,449
States : 1,616
Municipal : 1,121
Others : 439 |
 |
Number of casualties by type of area-focus on deaths
Residential : 1,300
Office : 570
Shopping : 140
Industrial / Construction : 230
School : 150 |
 |
Road Accident by hours of the Day -focus on the highest rate only.
Between 4pm-6pm : 690 deaths |
 |
Number of casualties by age group . focus on deaths.
6-15 : 440
16-25 : 2,310
26-45 : 1925 |
 |
CAUSES : Number of Drivers (car) involved by type of road accident.-focus on deaths
Not at fault (innocent) : 7,400
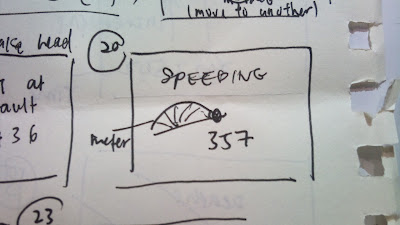
Speeding : 360
Driving too close : 110
we only focus on this 3 type of faults.
_______________________________________________________________________________________ |
Inspiration from other infographic videos~
Video : America's Public Health Crisis- Video Infographic
 |
| inspired for the age group. |
 |
| inspired us to ask what can we do to prevent road accidents. |
Video : The World is Obsessed with Fabecook
 |
| inspired for the arrangements for road accident by locality. |
________________________________________________________________
OurAnd then we started to sketch our storyline.
Softwares that we used to complete the whole video are Adobe Illustrator, Photoshop and After Effects.
Here is our final infographics video.
Thanks to my group members[YeeLin,Nigel,Kak,Eugene] because we work hard TOGETHER.
^v^


